We collect a lot of data at myAgro – everything from demographic data, to historic data, to harvest data. We use this data each week to understand opportunities and potential problems and to revise our current strategies and staffing needs accordingly.
For example, over the last 10 weeks we looked at the dates and times of purchases using a heat map, color-coding any payments that were at 30% intervals above or below the average payment total for a single day. One thing that was clear in this analysis of payment history is that our payments spiked in the middle to end of March when farmers received their payment from selling cotton to the government and therefore had more liquidity.
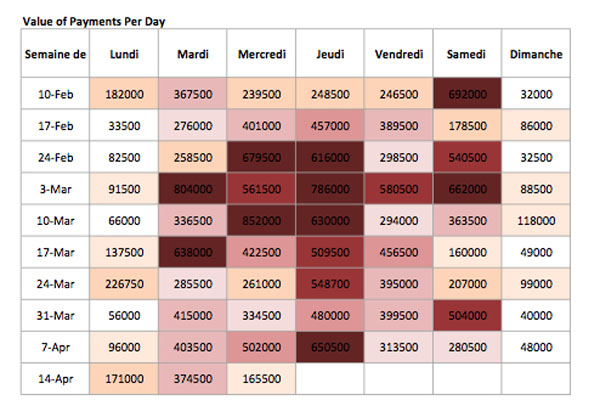
Color-coded heat map that shows when farmers make the most payments to their myAgro account.
This data also caused us to revise an assumption we had from the last two years. In our earlier years, 50% of our payments during a given week came in on Saturday, during the weekly market. This year, as we’ve expanded the number of villages and clients we work with, our payment trajectories during the week have also shifted: now around 25% of our payments on average come in on Thursdays. Dembele, our Regional Director, led a meeting recently with our field management team to discuss why.
Wednesday, it turns out, is a day when many of our villages host smaller local markets, and Friday is a day when savings groups often meet. Thursday might be a day when there is higher liquidity in the village between market day and savings group meetings, which explains the higher payment volume for myAgro.
Dembele and our field management team will distill this finding into actionable steps they can take to help encourage even more payments on Thursdays. Anytime we can fit myAgro’s payment model into existing behavior and consumer patterns farmers already demonstrate, the more successful our strategies ultimately are. Using data to develop these strategies is a key component of Dembele’s work as he leads our growing field team.